Top 15 U.S. Business School Rankings, Tuition Costs and Salaries Charts
The below charts are for the top 15 U.S. business school MBA programs based on an average of rankings from four sources: US News 2012, BusinessWeek 2012, Financial Times Global 2013, and the Economist 2012
For a more consolidated version, view the top 6 U.S. business school MBA programs.
Bar Chart showing the average ranking from four sources: US News 2012, BusinessWeek 2012, Financial Times Global 2013, and the Economist 2012 (lower is better)
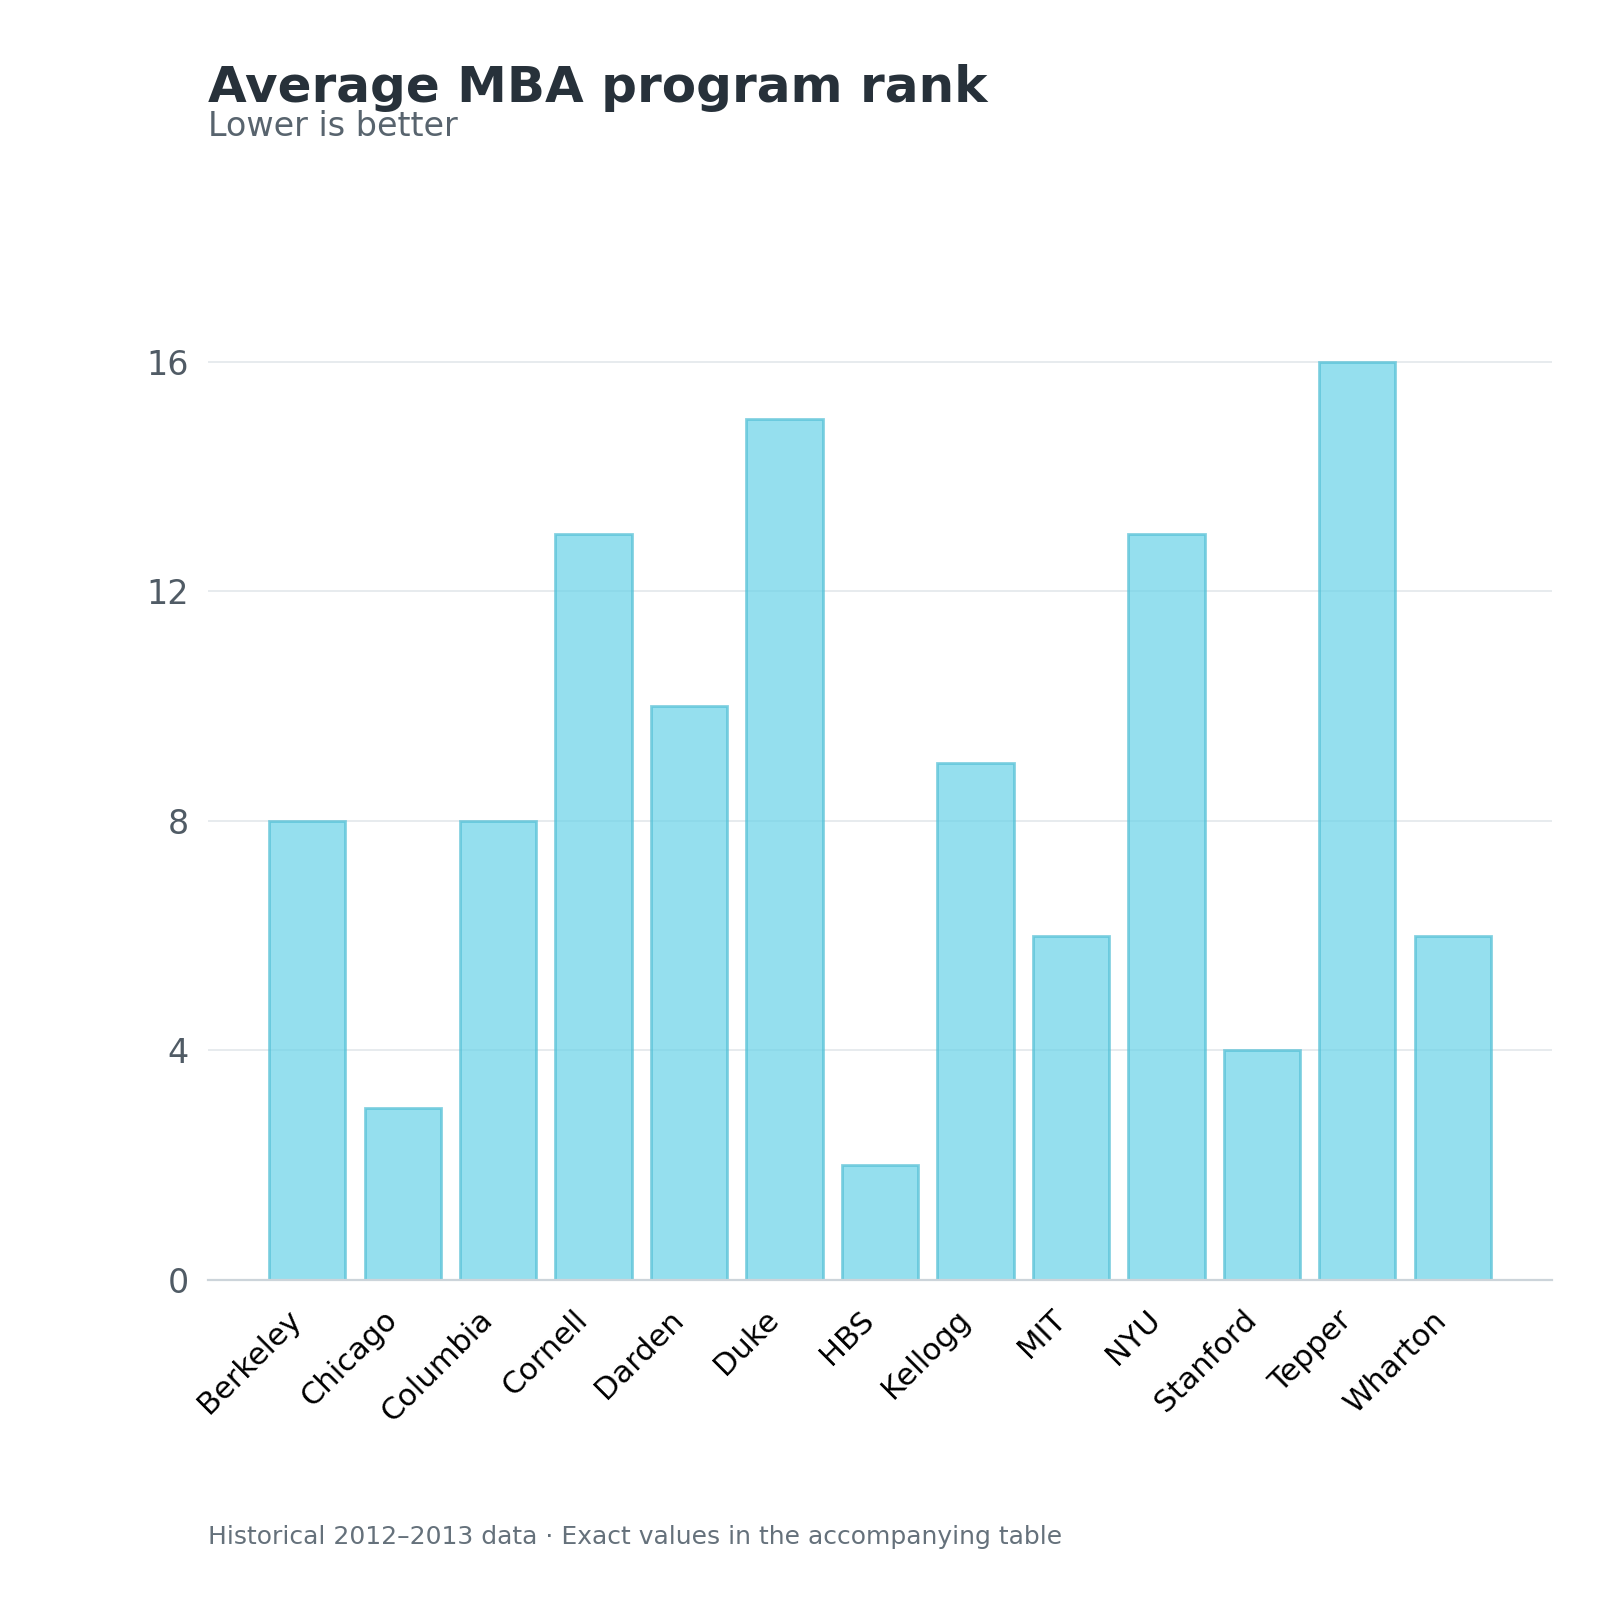
View data table: Average MBA program rank
| School | Mean rank |
|---|---|
| Berkeley | 8 |
| Chicago | 3 |
| Columbia | 8 |
| Cornell | 13 |
| Darden | 10 |
| Duke | 15 |
| HBS | 2 |
| Kellogg | 9 |
| MIT | 6 |
| NYU | 13 |
| Stanford | 4 |
| Tepper | 16 |
| Wharton | 6 |
Bar Chart showing the total expense for 2 years of tuition (in USD) using 2012-2013 data
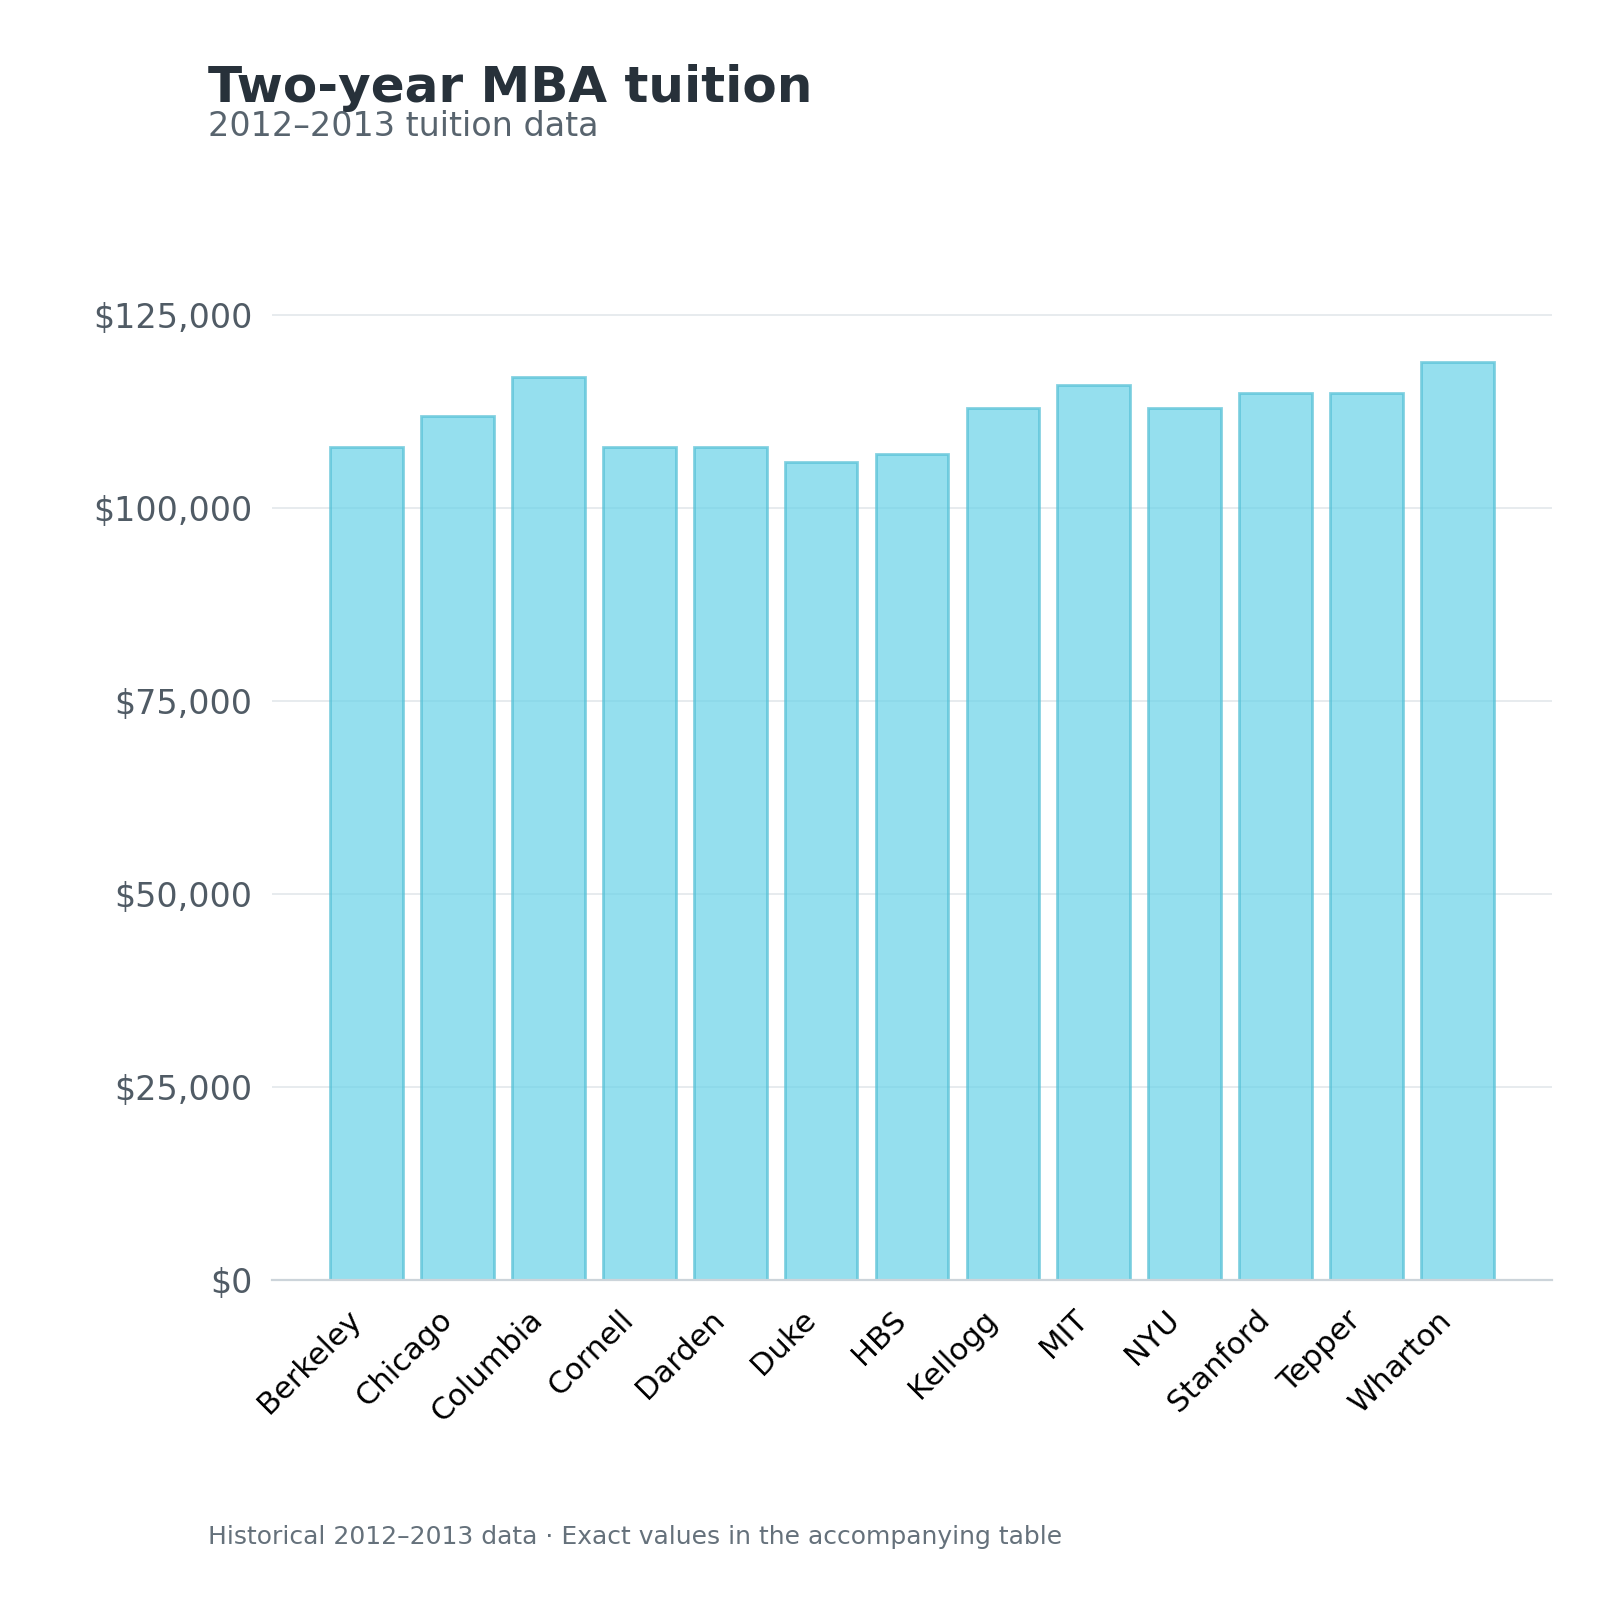
View data table: Two-year MBA tuition
| School | Two-year tuition (USD) |
|---|---|
| Berkeley | $108,000 |
| Chicago | $112,000 |
| Columbia | $117,000 |
| Cornell | $108,000 |
| Darden | $108,000 |
| Duke | $106,000 |
| HBS | $107,000 |
| Kellogg | $113,000 |
| MIT | $116,000 |
| NYU | $113,000 |
| Stanford | $115,000 |
| Tepper | $115,000 |
| Wharton | $119,000 |
Bar Chart showing the average 1st year salary (in USD) without bonus using 2012-2013 data
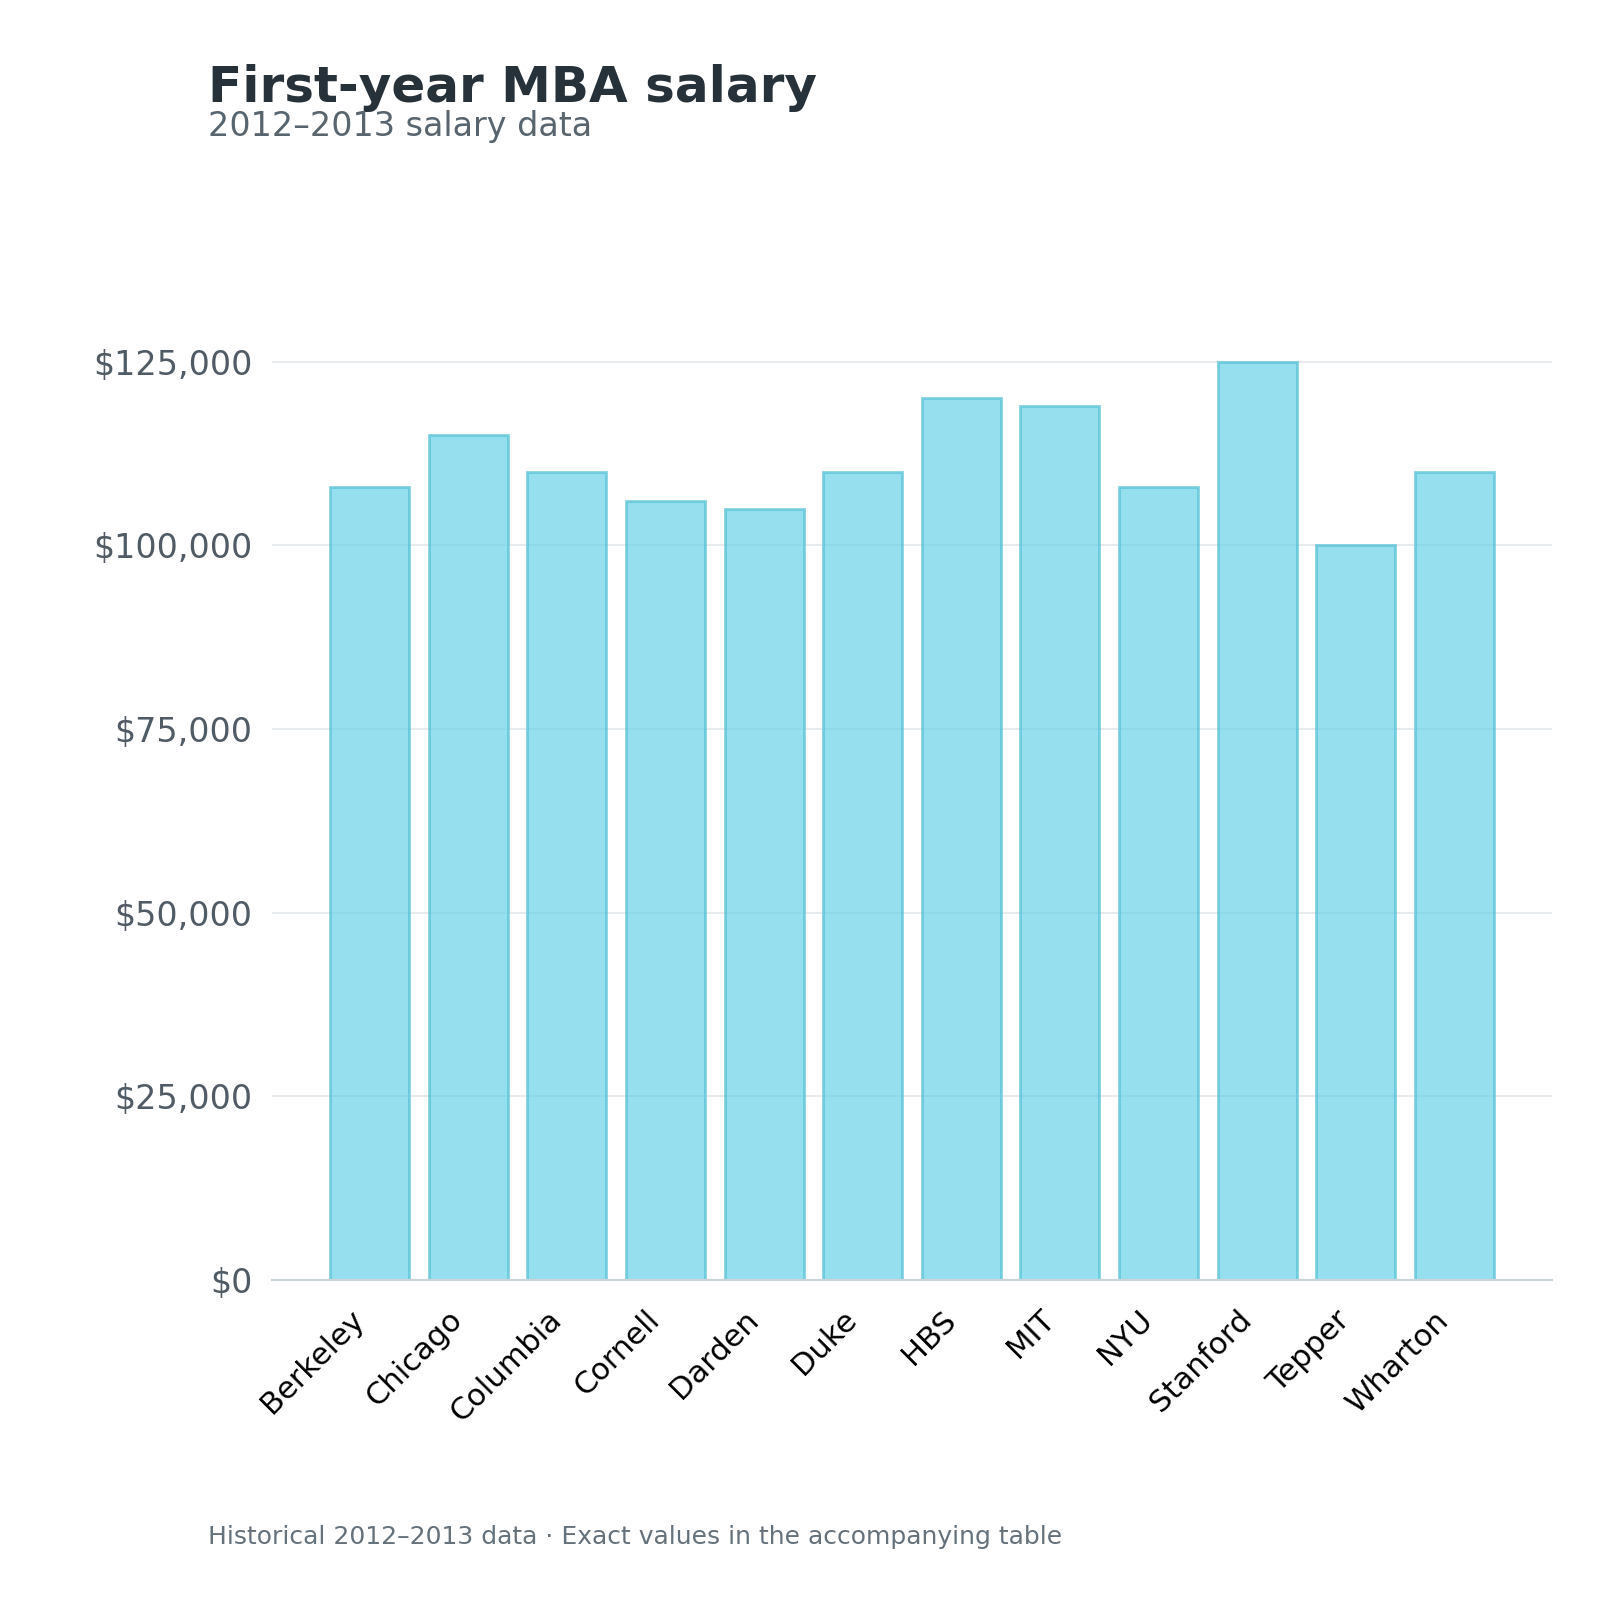
View data table: First-year MBA salary
| School | First-year salary (USD) |
|---|---|
| Berkeley | $108,000 |
| Chicago | $115,000 |
| Columbia | $110,000 |
| Cornell | $106,000 |
| Darden | $105,000 |
| Duke | $110,000 |
| HBS | $120,000 |
| MIT | $119,000 |
| NYU | $108,000 |
| Stanford | $125,000 |
| Tepper | $100,000 |
| Wharton | $110,000 |
Bar Chart showing the revenue/expenses ratio. Revenue being defined as the 1st year salary without bonus. Expenses being defined as two years of tuition costs. The break-even point is 1. Values greater than 1 break-even after the first year of revenue. (Larger value is better)
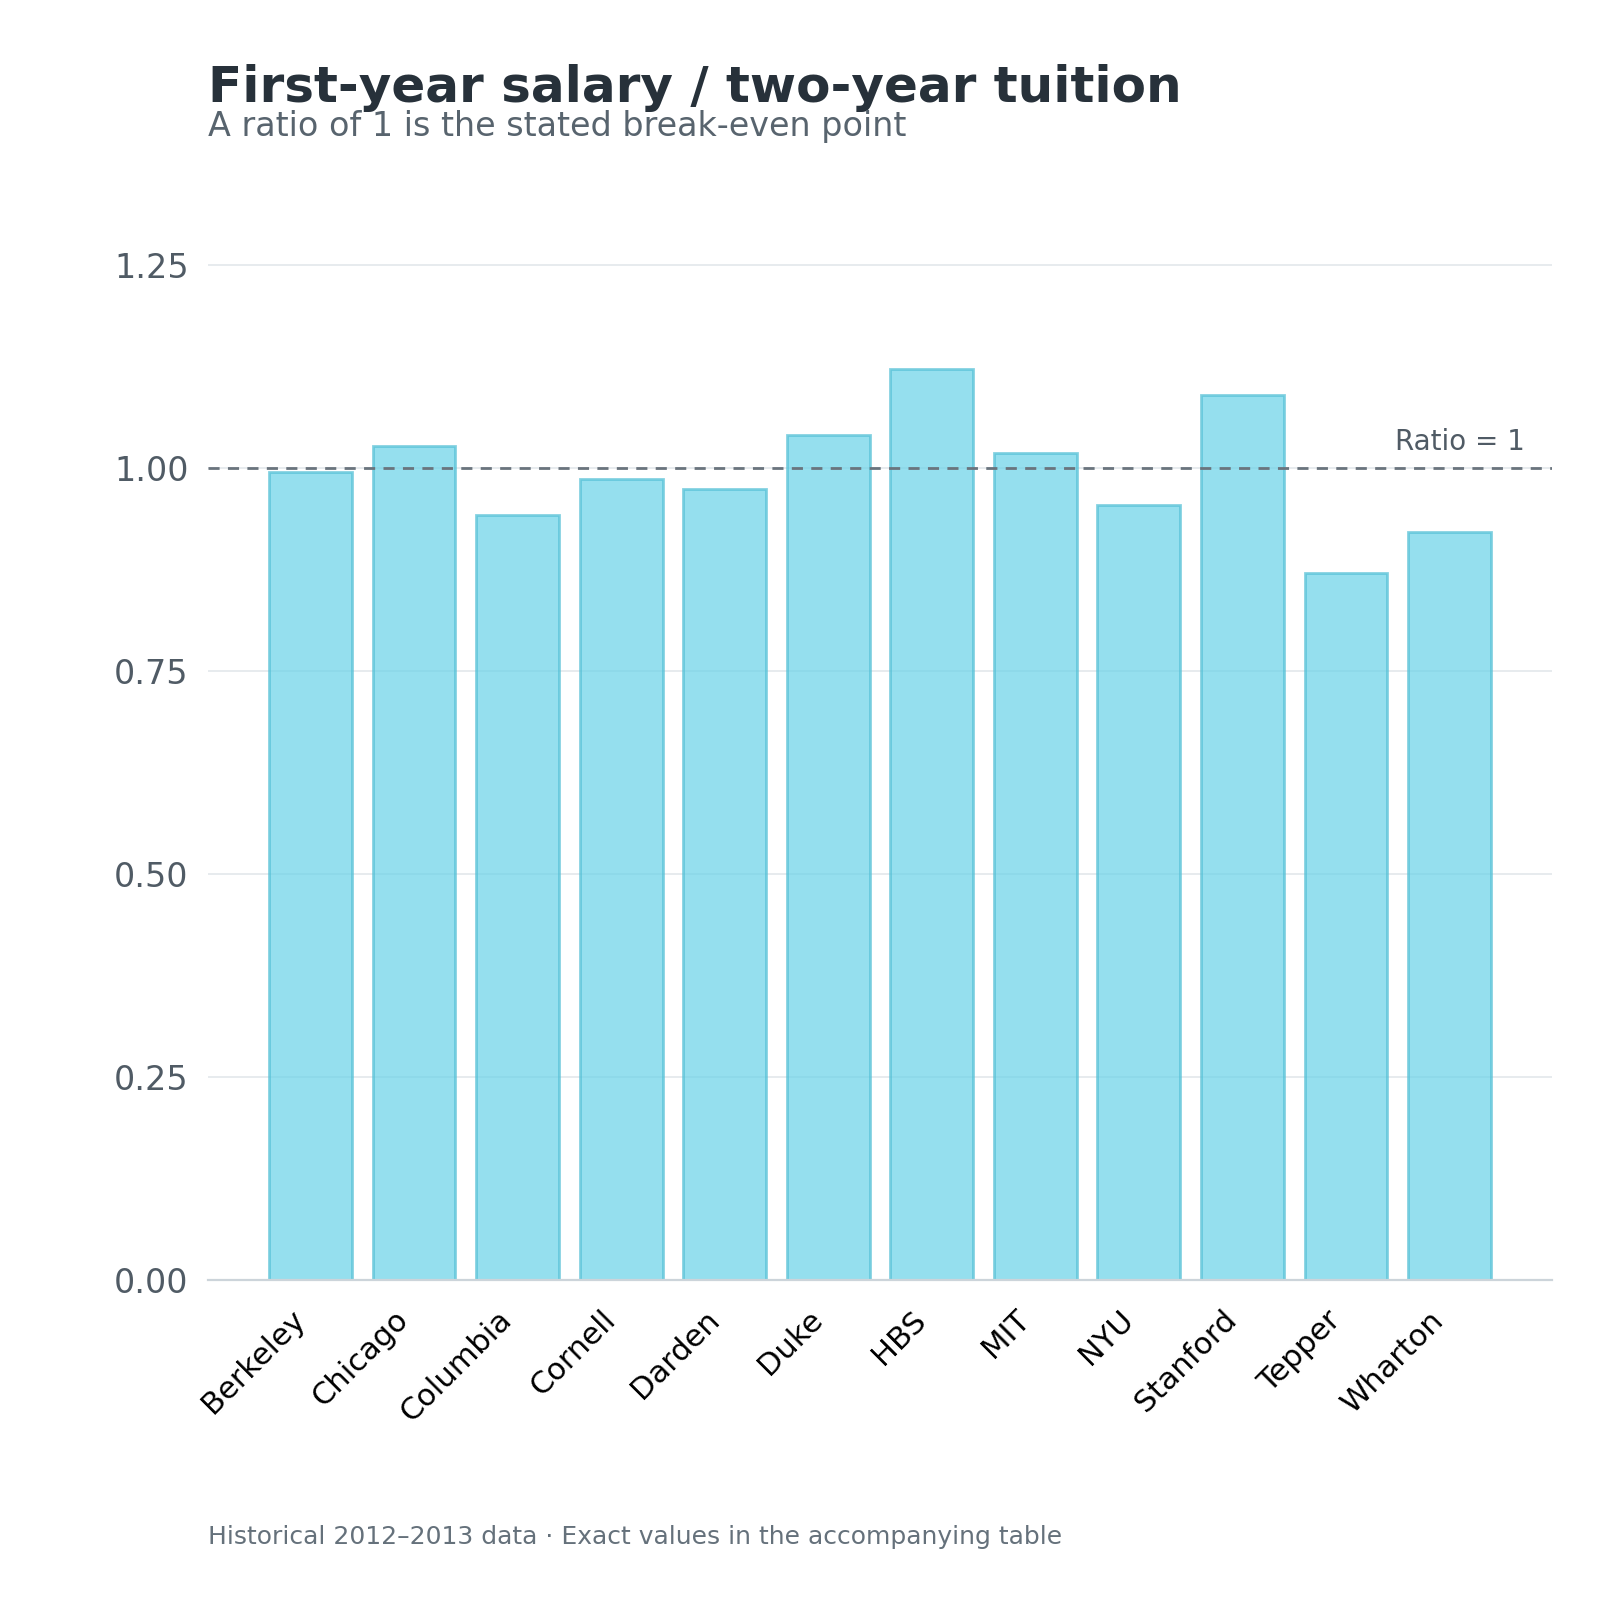
View data table: First-year salary / two-year tuition
| School | Salary / tuition ratio |
|---|---|
| Berkeley | 0.995 |
| Chicago | 1.027 |
| Columbia | 0.942 |
| Cornell | 0.986 |
| Darden | 0.974 |
| Duke | 1.040 |
| HBS | 1.121 |
| MIT | 1.018 |
| NYU | 0.954 |
| Stanford | 1.090 |
| Tepper | 0.870 |
| Wharton | 0.921 |